Rattling back up the tracks from Leeds after a super-fast visit to the EC Technology Enhanced Learning conference. Sadly I couldn’t stay for the main conference, but thanks to the efforts of Dr Adam Cooper, myself, Dr Maren Scheffel and Dr Liz Bennet had the pleasure of running a workshop to crowd-source principles for student-facing learning analytics dashboards.
Maren and Liz are both actively involved in research in this area and Adam and I share concerns from the operational side of Universities. The pitch we submitted (thanks Adam for doing most of the work) explains that whilst we are seeing an increasing interest in student-facing dashboards, recent research suggests that existing implementations are not best practice models.
A recent literature survey on the topic (Bodily & Verbert) – including sections covering design analysis, actual effects, and student perceptions of usability, usefulness, and system effects – concluded that more extensive, thorough, and rigorous research should occur as a foundation for effective student-facing LA.
A recurrent theme in these studies is a gap between what current software generally provides and the kind of product which will meet the aspirations of the TEL community. Arguably, some of the issues may have their roots in the dominant conception of learning analytics as a product, whereas Dollinger and Lodge argue that it is better conceptualised as a service (Dollinger & Lodge, 2018), where “value-in-use” provides a key lens. The workshop will reflect on how this relates to the attitudes of various stakeholders. (SFLAP website)
We wanted to use this workshop to investigate the research literature, and draw up a set of well-grounded principles that should be applied when considering the development or use of student-facing learning analytics dashboards. Outputs will follow in due course, and Adam has already started gathering some of the resources from the session on our website. Whilst it’s fresh I wanted to expand for posterity on what was in my slides.
We set up our session as something of a flipped classroom – asking colleagues to read the recommended papers in advance. Liz, Maren and myself each did 15 minutes at the start covering some key points to kick-start a few hours of hard work. Liz and Maren covered research that they have been involved in (h/t to Ioana Jivet at this point who couldn’t be with us, but who’s papers Maren covered and you should totally read from our reading list). My task was to present a short set of personal reflections over and above the deeper dives they provided into their work. Yikes! Many of the papers were ones I’d read already at various points, but I sat down last night and went over each of them again on the train to Leeds and it was a really enjoyable experience. Bear in mind that what follows is some really broad sweeps across a set of papers, my personal take, and is not a forensic analysis. There will be counter examples for nearly everything I’m about to write…
Reflections from the Research
Overall the papers suggest there’s still too much doing what’s easy going on, e.g. using the data that is easy to use for both design and evaluation of dashboards. Comparison to peers based on averages is still pretty persistent too. There’s a real risk imho that dashboards are at risk of creating a kind of pseudo-personalisation – touted as personalised, but not at all connected to individual goals, motivations or performance.
Knox (2017) poses the question about the extent to which data availability is shaping the research agenda more generally, and after reading this clutch of papers I am inclined to share his concerns.
I am also sceptical about whether there is or can be such a thing as a single student-facing dashboard that would work at the institutional level…(one dashboard to rule them all, and in the darkness bind them?)
Some Problems
Big claims are being made for student-facing reporting systems:
- “enable student autonomy and could increase motivation”
- provide feedback to learners to improve teaching and learning
However my overriding impression was of a significant number of dashboards focused on retention, and/or using unvalidated predictions, rather than an explicit focus on supporting pedagogy. As Jivet et al. (2018) spell out in painful detail, formal validation of student-facing dashboards is weak, and the EU report (Ferguson et al.) pulls no punches in saying that there is currently little practical evidence for LA supporting effective and efficient learning processes. Many of the validation activities that have been carried out have been stronger on measuring student perceptions than actual effects; and where they have focused on usability of dashboards, there is low use even of formal usability testing techniques. Bodily and Verbert pull no punches either when they say “Creators of many systems have not conducted rigourous research on their student-facing systems”. Their paper highlights that of the 94 articles reviewed, only 6 described carrying out a needs analysis and very few gave significant justification for the information selection they used.
Some Ideas
The papers we selected are proactive in not just identifying short-comings with student-facing dashboards, but suggesting routes forward. They were fertile ground for ideas:
We should consider engagement with dashboards as a literacy practice rather than a technical skill (Bennet et al.) embedding student-facing learning analytics into the pedagogical structures of our courses, and into the wider learning environments students use.
It is useful to think of learning analytics as a service and not a product, and use co-creation as a strategy to reach “fit for purpose” learning analytics (Dollinger et al.). This poses particular challenges for the likes of Adam, working for a supplier. Co-creation requires investment in time to understand each other, build trust and leave baggage at the door. Time is often a luxury for all of us. Any co-creation process will need to consider how to engage with the power imbalances inherent in our institutions, but has the potential to identify diverse needs and improve sense-making processes. Engaging all stakeholders can build more informed use of data connected to real needs.
Analytics “should provide delight” (Ferguson et al.). Several of the research papers highlighted the lack of focus on the emotional impact of dashboards.
“Successful analytics do not begin with a set of data; they begin with an understanding of how people learn. There is a need for novel, innovative pedagogy (theorised approaches to teaching and learning) that drives innovation and makes use of data to solve practical problems…” (Ferguson et al.)
Dashboards should support students to challenge data presented, not be held hostage by it (Knox, Bennett). I also used this as a brief opportunity to wax lyrical that we have a duty as educational institutions to use things like student-facing dashboards to serve a broader purpose – to help our students understand how they are constituted as data subjects outside the classroom (look – it’s literacies again).
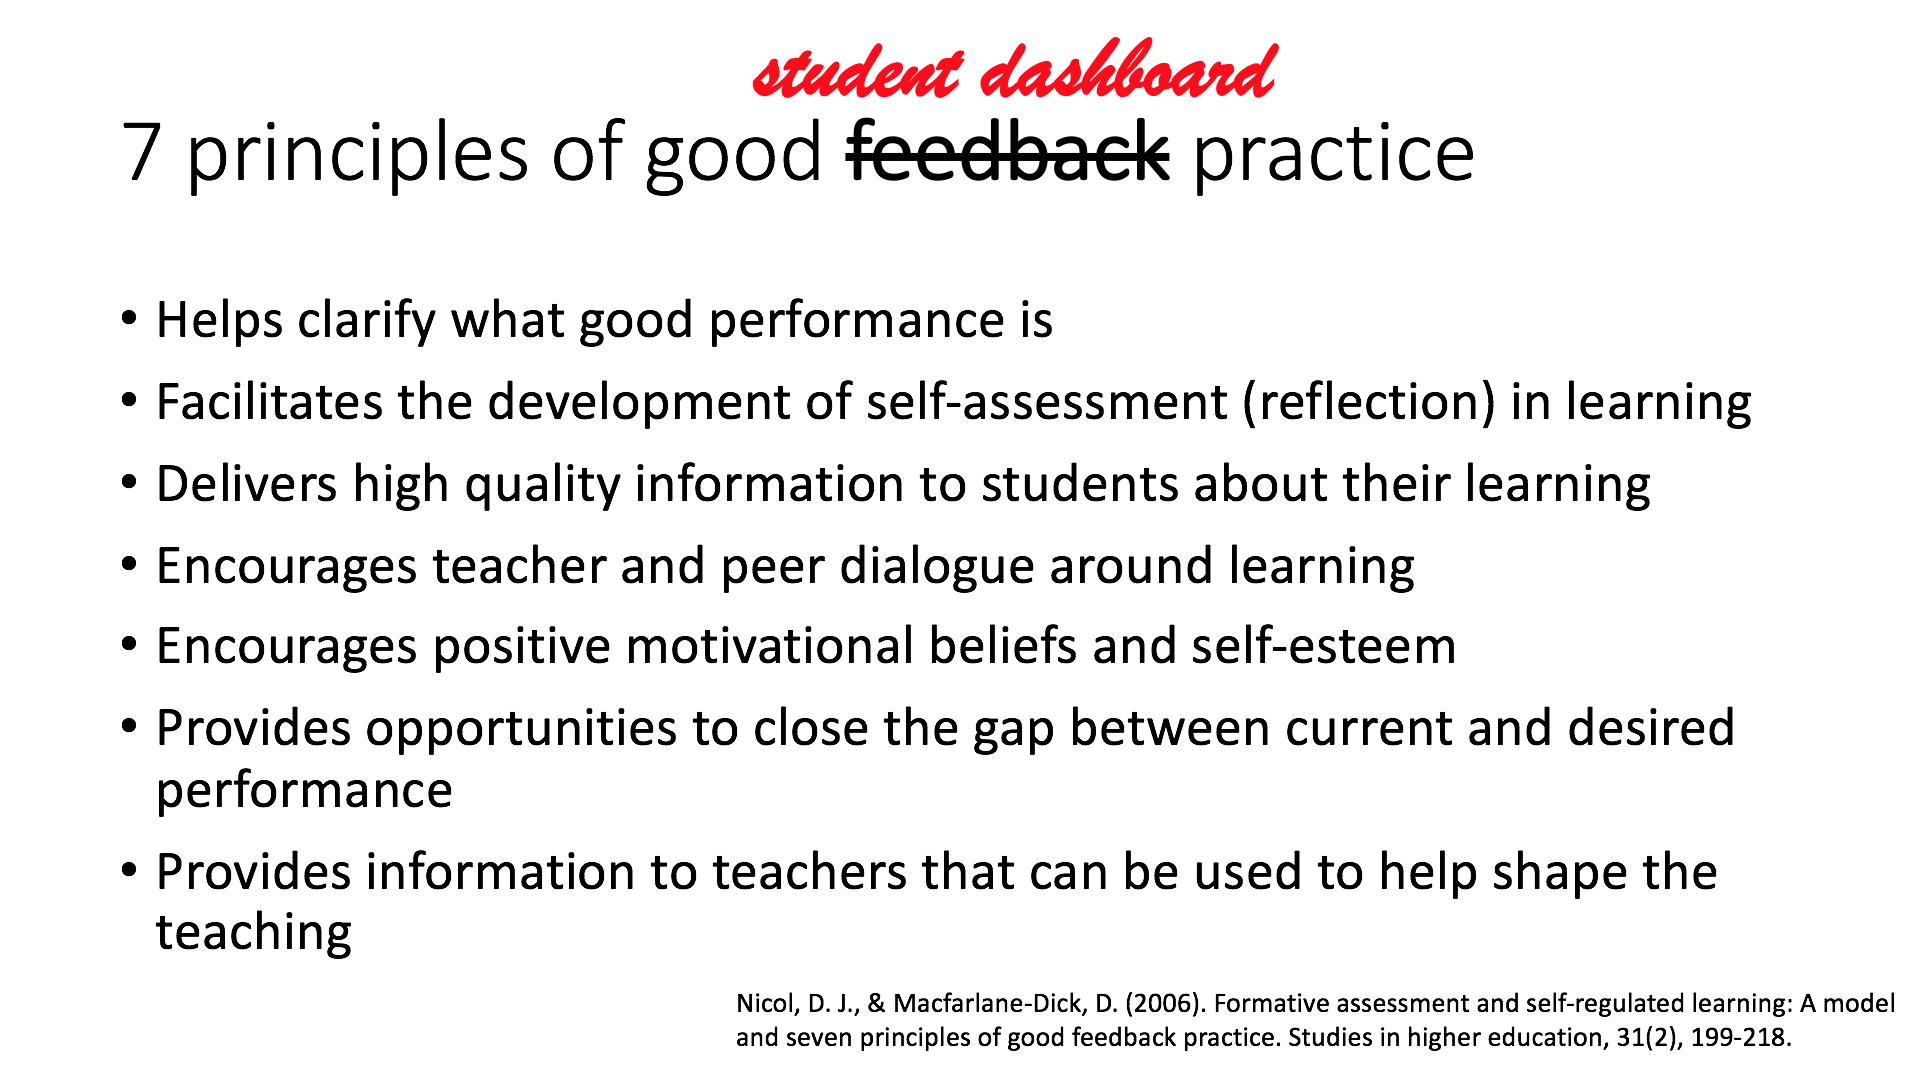
Given I’d already used the word “literacies” several times, I decided to just go for it and ended with this slide. This is straight from an excellent 2006 paper on feedback literacies and frankly if we are thinking that student-facing dashboards aren’t a form of feedback…
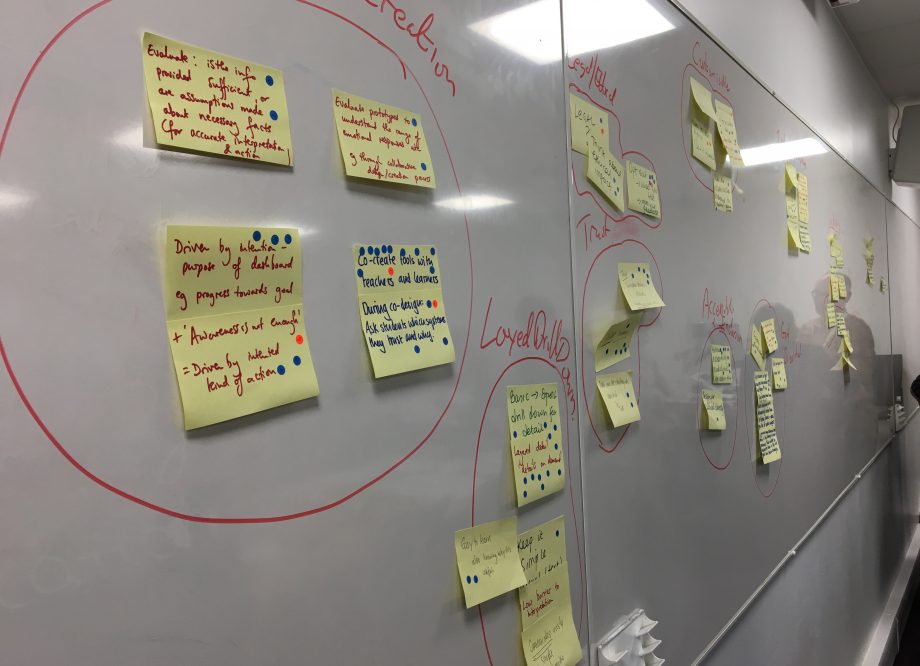
After our intros we got down to the hard work of drawing up some principles, using the research and some example designs as stimulus. Sharpies, post-it notes, clustering, dot voting. We did it properly. Next steps are to write up the outputs, finesse and then release as a CC licensed document. Watch this space.